Attendance analytics and trends
Attendance is the denominator of every number that matters in a gym.
The headline numbers
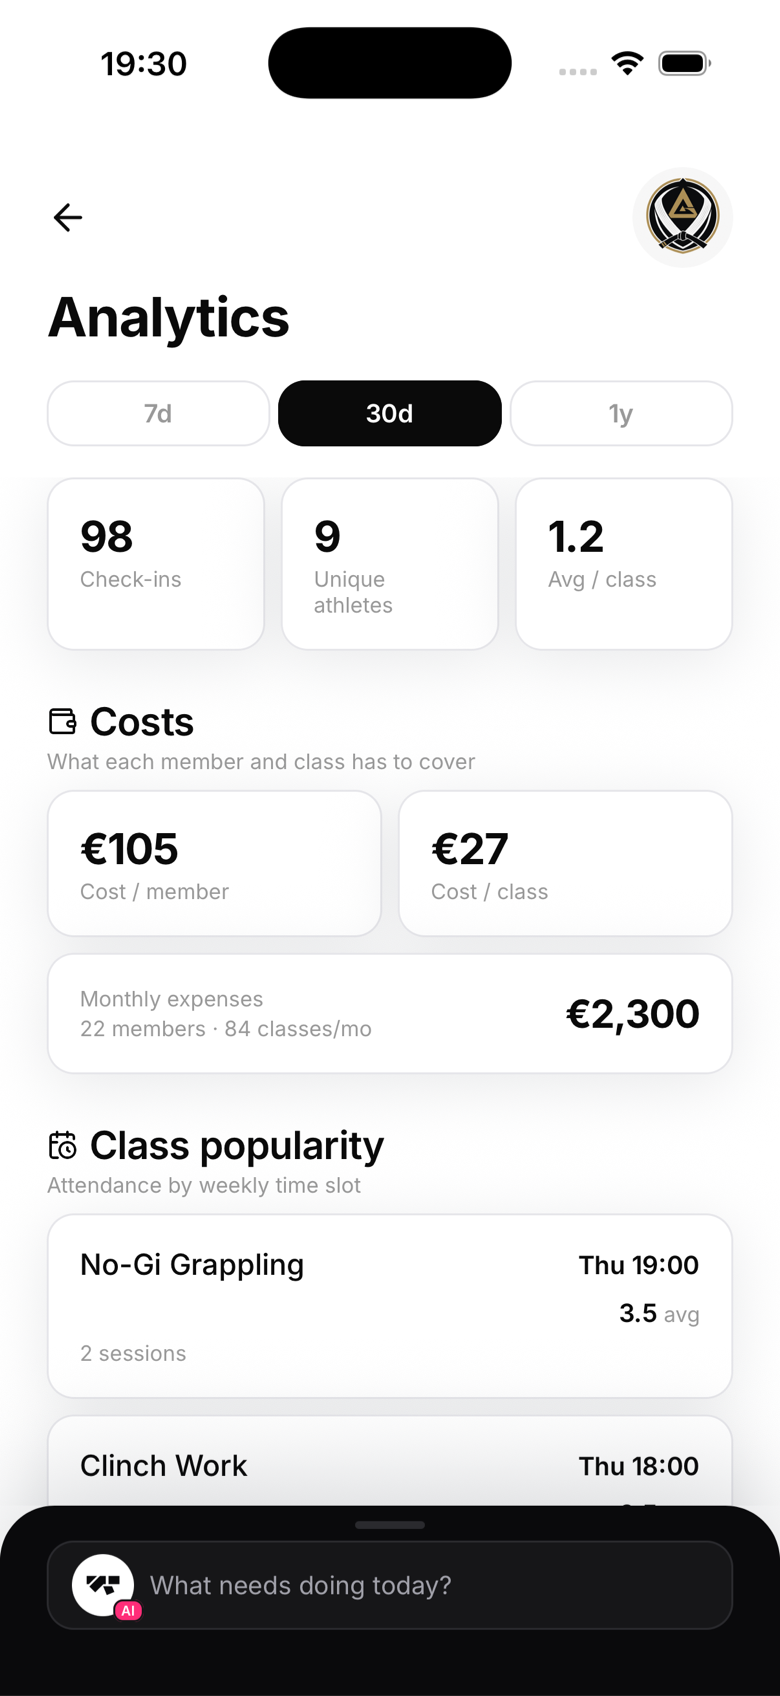
Open Analytics from the Cadimia tab and pick a window (7 days, 30 days, a year):
- Check-ins: total attendance in the window
- Unique athletes: how many different people those check-ins came from
- Average per class: the fill number that tells you if the timetable matches demand
Class popularity
Attendance by weekly time slot shows which classes carry the gym and which are quietly dying. A Thursday slot averaging 2 next to a Monday slot averaging 14 is a timetable decision waiting to be made.
Cost per class, cost per member
Add your monthly expenses and analytics divides them by attendance reality: what each member and each class actually costs you. A class that costs €27 to run and averages three attendees on a €10 drop-in rate is a fact worth knowing before renewal season.
Watching trends over time
Compare the 7-day and 30-day windows to spot momentum; use the year view for seasonality (January surge, summer dip) so you plan capacity and promotions around it rather than react to it.