Help Center › Billing & Payments
Understanding your gym analytics
Revenue says what came in; analytics says why, and what it cost to earn.
What's on the screen
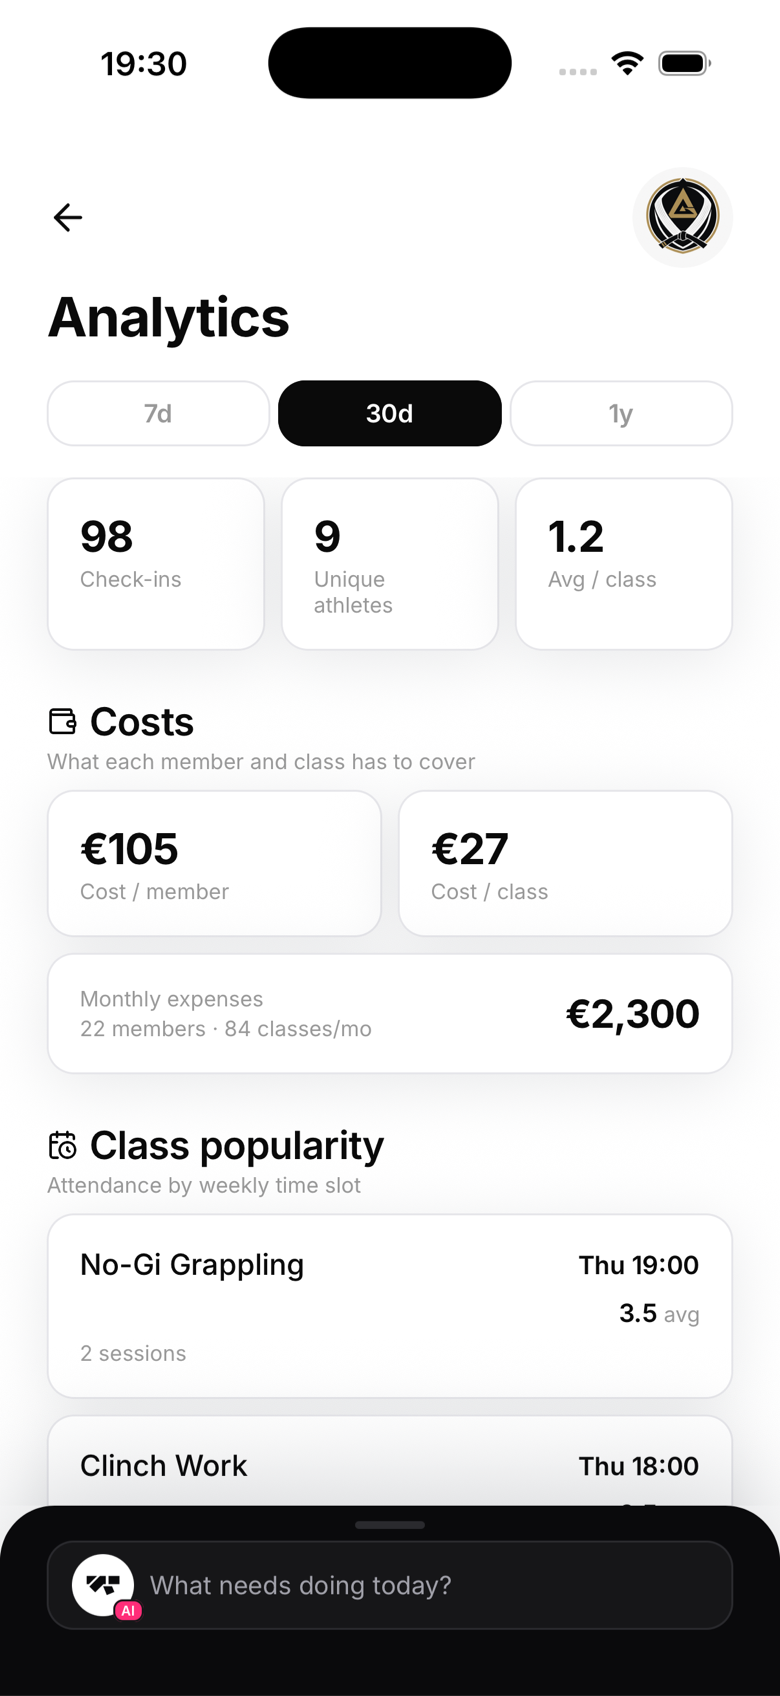
Open Analytics from the Cadimia tab:
- Attendance trends: which classes fill and which are fading, so you adjust the timetable before members drift
- Instructor load: who's carrying the timetable, so a coach doing double duty is visible before they burn out
- Monthly expenses and cost per member: add your expenses (rent, coach pay, insurance) in Finances and analytics divides reality by headcount. A gym with 80 members and €4,000 of monthly cost runs at €50 per member; you want your average plan priced above that number
How it fits with Finances
Finances is money in: payments collected, revenue by martial art, expected income. Analytics is the operational layer underneath: attendance, load, and unit cost. Check Finances weekly, analytics monthly.
Notes
- Some tiles need history before they're useful; "not enough data" resolves itself after a few weeks of check-ins
- Export what you need for your accountant from the relevant screens rather than screenshotting charts